Campaign Dashboards
Unified analytics across every traffic source.
The problem
Affiliate operations run campaigns across multiple traffic sources — Google, Facebook, Taboola, Outbrain, and more. Each source has its own dashboard, its own metrics format, its own reporting cadence. Your tracker (Voluum, RedTrack) has the conversion data. Your sources have the cost data. And somewhere between them, you’re trying to figure out if you’re profitable today.
Generic BI tools (Looker, Tableau, PowerBI) can visualize data, but they don’t understand affiliate economics. They don’t know what EPV means, why day-wise breakdowns matter more than weekly summaries, or how to reconcile cost data from a traffic source with revenue data from a tracker.
How it works
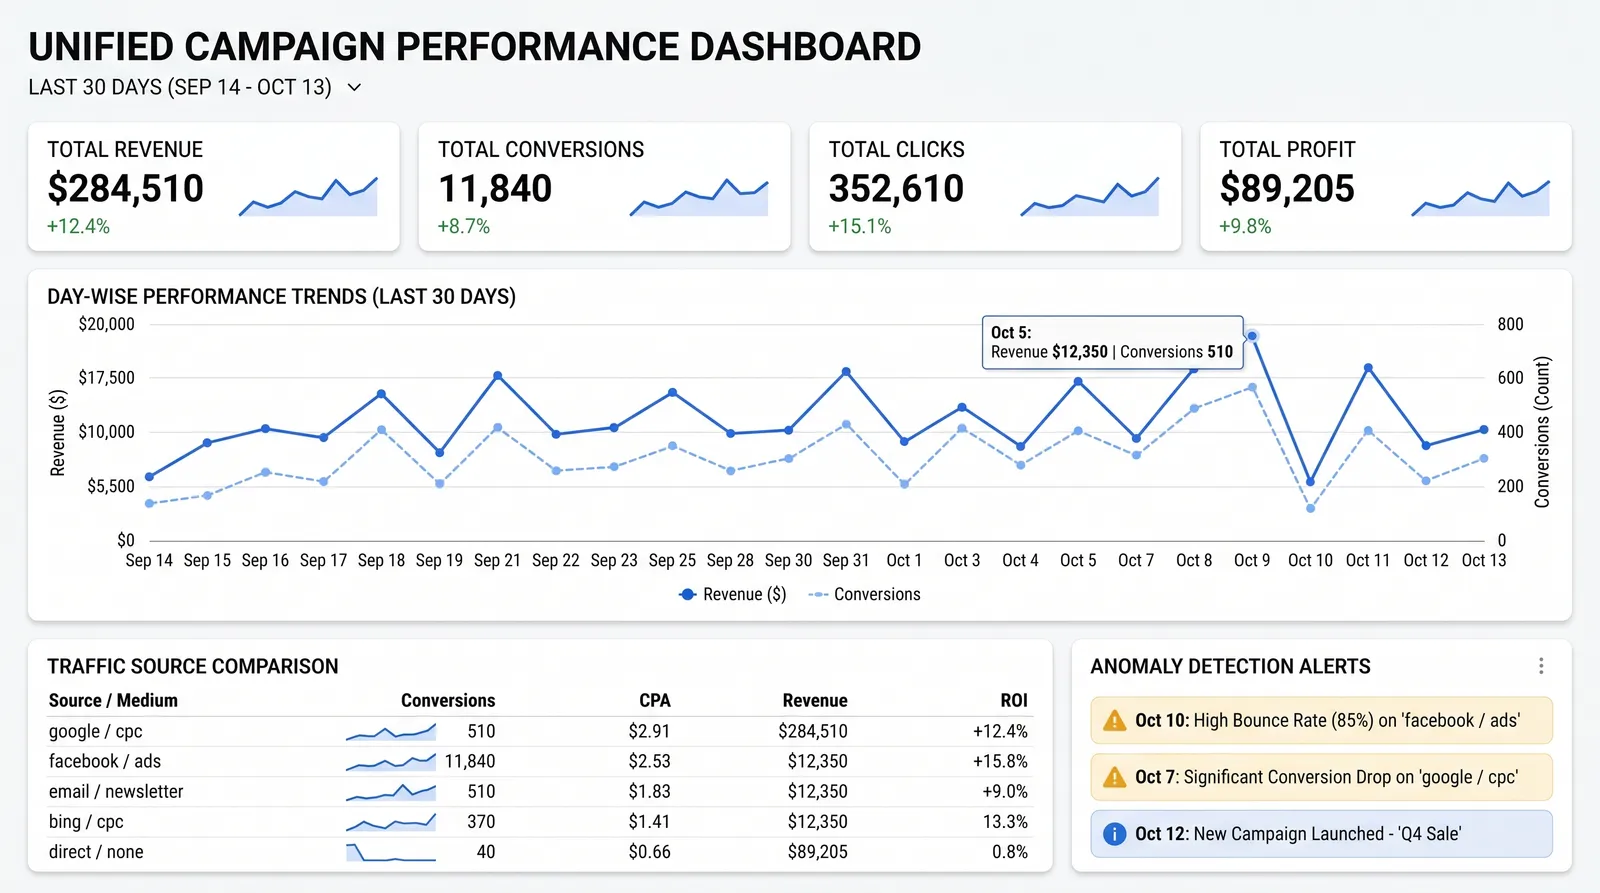
Campaign Dashboards connect to your tracker and traffic source APIs through automated data pipelines. Data flows in continuously — costs from sources, conversions from your tracker, calculated metrics like EPV, CPV, and ROI per placement.
Each traffic source gets its own dashboard tuned to its specific metrics and dimensions. A unified view sits on top, showing cross-source P&L, performance trends, and anomaly alerts.
Anomaly detection compares current performance against each campaign’s recent history. When spending spikes without a corresponding conversion increase, or when a high-performing placement drops suddenly, the system alerts your team immediately.
How this is different from Campaign Analyst
Campaign Dashboards and Campaign Analyst are complementary, not competing.
Dashboards are the visual layer — charts, trends, anomaly alerts, P&L reconciliation. They show your team the picture.
Campaign Analyst is the conversational AI layer — ask questions in natural language, get specific recommendations backed by your data. It tells you what to do about the picture.
Most operations need both. Dashboards for the daily view. Analyst for the deep-dive decisions.
Who this helps
- Agencies running traffic across multiple sources who need unified P&L and anomaly detection
- Networks managing campaign infrastructure across affiliates who need reporting at scale
- Advertisers with in-house media buying who need visibility into campaign performance across channels
Capabilities
Multi-source unified P&L
Campaign data from every traffic source flowing into one dashboard. See your entire operation's profit and loss without logging into five different platforms.
Day-wise performance breakdowns
Drill into any campaign by day, source, or offer. Spot trends that weekly summaries hide — the kind of granularity affiliate economics demand.
Anomaly detection
Spending spikes, conversion drops, and performance anomalies flagged automatically. The system watches what humans miss during off-hours.
Automated alerting
Alerts pushed to Slack, Telegram, or email when metrics cross thresholds. Your team knows about problems before the morning standup.
What changes
Ready to see Campaign Dashboards in your operation?
Tell us about your operation to see if it's a fit. Discovery calls are free.